All Research
41 findings on what it means to be Wasian in America and beyond.
Identity 4
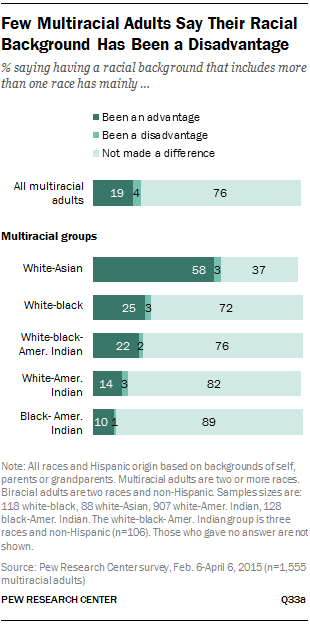
58% of Wasian adults said their mixed-race background has been mainly an advantage. Compare that to 25% of White-Black, 14% of White-Native American, and 10% of Black-Native American biracial adults.
An award-winning 2024 study found that Wasians stand in solidarity more strongly with Asian people than White people, even when they believe they physically look White. However, monoracial Asian people incorrectly assume that White-passing multiracial individuals side more with White people.
Pew Research Center found that White-Asian biracial adults lean heavily toward their White social networks: 44% say all or most of their close friends are White, compared to just 7% who say the same about Asian friends. They also feel more accepted by White people (62%) than by Asian people (47%), and 61% report a lot of contact with White relatives versus 42% with Asian relatives.
Pew Research found that 30% of White-Asian biracial adults said they were teased or made fun of as children because of their mixed racial background — about three times the rate of White-American Indian (10%) or Black-American Indian (11%) biracial adults.
Family 2
Asian-White couples had a divorce rate of ~8.4%, compared to ~10% for White-White couples and ~1.4% for Asian-Asian couples. That makes Asian-White couples 23–27% less likely to divorce than same-race White couples, contradicting the assumption that interracial marriages are less stable.
Census data shows that 47.8% of White-Asian households speak a language other than English at home, compared to 72.3% of Asian-alone and just 5.4% of White-alone households — positioning Wasians as a uniquely bilingual demographic bridge.
Economics 6
Wasian children grow up in some of the highest-income households of any racial group in the country. Census ACS data shows that White-Asian married-couple households have a higher median household income than either White-White or Asian-Asian couples. The pattern is driven by selection: highly educated White professionals disproportionately marry high-earning Asian-American immigrants, so Wasian kids inherit the combined wealth and human capital of two of America's most economically successful groups.
The counties with the highest Wasian percentages are also some of the richest in the United States. Falls Church city, Loudoun County, Fairfax County, and Arlington County — all in the DC suburbs — have Wasian shares in the national top 10 and also rank among the top 10 U.S. counties by median household income. The Bay Area and Seattle-area clusters follow the same pattern. Wasian kids are disproportionately raised in neighborhoods with elite schools, low poverty, and very high adult educational attainment.
A 2018 economics study using American Community Survey data found that biracial Asian-White Americans show no evidence of the "glass ceiling" effect that limits monoracial Asian Americans' advancement into top positions. While Asian Americans make up 13% of the professional workforce, they hold just 1.4% of Fortune 500 CEO roles.
Mixed White-Asian intermarried couples have higher median incomes than either Asian-Asian or White-White couples. White-Asian multiracial people tend to be raised in households with relatively high incomes and live in predominantly White, more affluent neighborhoods.
Wasian children are unusually likely to have two college-educated parents. Pew's Multiracial in America survey found that White-Asian biracial adults reported higher rates of parental college education than any other biracial group. Census ACS data backs this up: among White-alone-Asian adults, the share with a bachelor's degree or higher exceeds 60% — well above White-alone and roughly on par with Asian-alone, the two most-educated single-race groups in the country.
Raj Chetty's Race and Economic Opportunity project ranked every U.S. racial group by the parental household-income percentile their children are born into. Asian-American children sit at the very top of that distribution, well above White children — and Wasian children, who pull from both pools, inherit parental income percentiles that sit at or above the Asian-American baseline. In Chetty's framework, this is a structural head start that almost no other group in America starts with.
Demographics 7
There were 2.7 million Wasians in the 2020 Census, making it the 4th largest multiracial combination in the U.S. The Wasian adult population grew 87% between 2000 and 2010 alone.
Among Americans younger than 18, White-Asian multiracial children numbered 941,000, making them the second-largest multiracial group among youth after White-Black. The multiracial child share of the population (15.1% in 2020) is nearly triple the adult share.
The overall multiracial population exploded from 9 million in 2010 to 33.8 million in 2020, a 276% increase. While improved Census methods account for some of this, real demographic change from rising intermarriage is a major driver. Multiracial Americans now constitute 10.2% of the U.S. population.
Among the six largest Asian origin groups, Japanese Americans have the highest multiracial rate at 38%, followed by Filipinos (21%) and Koreans (17%). Japanese Americans have outmarried at rates of 34% since the late twentieth century, far exceeding Chinese Americans at 15%.
Nearly one-in-four Hawaii residents (24%) identify as multiracial, far above any other state. The vast majority (70%) are some combination of White, Asian, and Native Hawaiian/Pacific Islander.
The median age of Americans who identify as multiracial is roughly 22, compared to 38 for the U.S. as a whole and 44 for non-Hispanic Whites. Wasians are even younger on average — about 45% are under 18 — meaning the demographic story of multiracial America is overwhelmingly being written by Gen Z and Gen Alpha.
The 2000 Census was the first to allow Americans to select more than one race, after decades of advocacy by multiracial families. Before 2000, all multiracial individuals were forced into a single racial category, effectively erasing their mixed heritage in official statistics.
Education 4
Wasian children scored higher in math and reading in kindergarten than both monoracial White and Asian peers in this study. Part of this is explained by the fact that their parents tend to be more educated and wealthier. However, even when parent education, income, and occupation prestige were the same, Wasians outperformed Whites and Asians. It is surprising that Wasians score above both groups, because mixed Black/White and White/Latinx people scored between their groups' averages.
Just 4.6% of White-Asian adults lack a high school diploma, the lowest rate of any racial group — lower than White-alone (6.1%) and far below Asian-alone (11.6%). This reflects the high educational floor in Wasian households.
Research published in PNAS found that the Asian-American academic advantage over Whites is attributable mainly to greater academic effort, not cognitive ability or sociodemographic advantages. Asian and Asian-American students tend to view intelligence as developable through effort.
The model minority myth creates intense academic pressure on Asian American students, leading to anxiety and underperformance through stereotype threat. Teachers' high expectations based on the stereotype can prevent students from seeking help.
Dating 4
A 2024 study found that biracial Asian-Caucasian faces were rated more trustworthy, attractive, intelligent, healthy, and career-promising than monoracial faces by both American and Chinese participants.
On a major US dating site, Wasian men sent messages most often to other Wasian women, followed by Asian women, with white women third.
In 2015, 36% of newlywed Asian women married someone of a different race compared to only 21% of Asian men. Among U.S.-born Asians, the gap widens further: 54% of women vs. 38% of men intermarried.
The percentage of White women marrying Asian men reached its highest rate ever in 2023 at 1.4%, a nearly 60% increase from 0.9% in 2008. While the WM/AF pairing still dominates, the gap is narrowing as U.S.-born Asian men increasingly outmarry.
Career 2
Asian Americans make up 13% of the STEM workforce despite being 6% of the labor force, including 20% of computer workers. Yet only 2% of S&P 500 CEOs are Asian American, and the figure has stalled for a decade.
Almost 60% of Asian Americans report having faced discrimination due to race or ethnicity. One in five say they experienced workplace discrimination specifically, including unfair hiring, pay, or promotion decisions.
History 6
The War Brides Act of 1945 and its extensions enabled foreign spouses of U.S. servicemen to immigrate. Between 1947 and 1975, an estimated 66,681 Japanese and 28,205 Korean women entered the U.S. as military spouses, creating one of the earliest large waves of White-Asian families.
Early Asian immigration laws created a stark gender imbalance. In 1882 alone, 39,579 Chinese entered the U.S. — only 136 of them women. By the 1880s, men in Chinatown outnumbered women roughly 20 to 1.
The Immigration and Nationality Act of 1965 abolished the national-origin quotas that had effectively barred most Asian immigration since 1924. Asian-born immigrants jumped from less than 6% of arrivals in 1960 to over 30% by the 1990s. Almost every demographic curve on this site — from Wasian birth rates to professional-hub clustering — traces back to this single law.
In the final two weeks of the Vietnam War (April 1975), the U.S. evacuated about 3,300 South Vietnamese children—many of them mixed-race Amerasians (children of U.S. servicemen)—to adoptive homes in the U.S., Canada, Australia, and Europe.
Signed in 1987, the Amerasian Homecoming Act brought 21,000 Wasian children home by letting Vietnamese children of American servicemen and their immediate families immigrate to the United States. Between 1988 and 2009, approximately 21,000 Amerasians plus more than 55,000 family members entered under the program—one of the largest deliberate Wasian migrations in U.S. history.
Since the Korean War, an estimated 200,000+ Korean children have been adopted internationally, with roughly 110,000–150,000 placed with families in the United States—most of them White families. Many of the earliest adoptees were themselves Wasians, children of American soldiers and local Korean women from the Korean War.
Sociology 1
UCLA researcher Margaret Shih found that multiracial individuals develop two key psychological coping strategies: identity switching (adapting racial presentation to context) and de-essentializing race (viewing it as socially constructed). Both strategies are linked to greater creativity and psychological resilience.
Culture 1
Artist Kip Fulbeck's Hapa Project, started in 2001, photographed over 1,200 self-identified hapa individuals across the U.S., each answering 'What are you?' in their own handwriting. In 2025, Fulbeck re-photographed 130 original participants, exploring how self-definitions evolve over 25 years.
Global 4
Japan's Ministry of Health estimates that 1 in 30 children born in Japan have one non-Japanese parent. Despite this, 'hafu' (half-Japanese) individuals face persistent identity challenges: being treated as foreigners, stereotyped as bilingual models, or bullied in school.
Japanese-Chinese and Japanese-Korean mixed individuals, called 'invisible hafu,' can pass as monoracial Japanese but face discrimination when they reveal their non-Japanese heritage. Research found that identity is shaped not only by self-perception but by how society identifies them.
Singapore's Eurasian community — roughly 16,000 people — traces back to 16th-century Portuguese, Dutch, and British mixing with local Asian populations. Despite being classified under the catch-all 'Other' category, Eurasians maintain distinct cultural markers including devil's curry cuisine and the Kristang creole language.
In the 2001 UK Census, 189,000 people identified as Mixed White and Asian. By 2009 it had grown to 292,400. The broader Mixed ethnic group reached 1.8 million (2.7%) by 2021. Research found that East/Southeast Asian-White individuals in Britain are often denied recognition as 'British.'